08 · Observability in production
Level: production · Read time: ~18 min Sources: Go SDK — Observability · Go SDK — OpenTelemetry v2 integration · SDK metrics reference · Go SDK — Context propagation
1. The problem
The previous chapters each added one signal: logs (02), a tenant carried across boundaries (03, 04), SDK metrics (05), traces (06, 07). In production they have to work together:
- An alert fires on a metric. You need the Workers behind it: which team, which service, which version.
- A merchant reports a stuck order. You need to go from the order ID to its logs, from a log line to its trace, and from the trace to the Workflow in the Web UI.
- A pod is killed during a deploy. The last spans and metrics must not vanish with it.
This chapter assembles everything into one telemetry package used by the API and the Worker, proves with a test that one checkout produces a connected trace, correlated logs and tagged metrics, and ends with a checklist.
2. The target picture
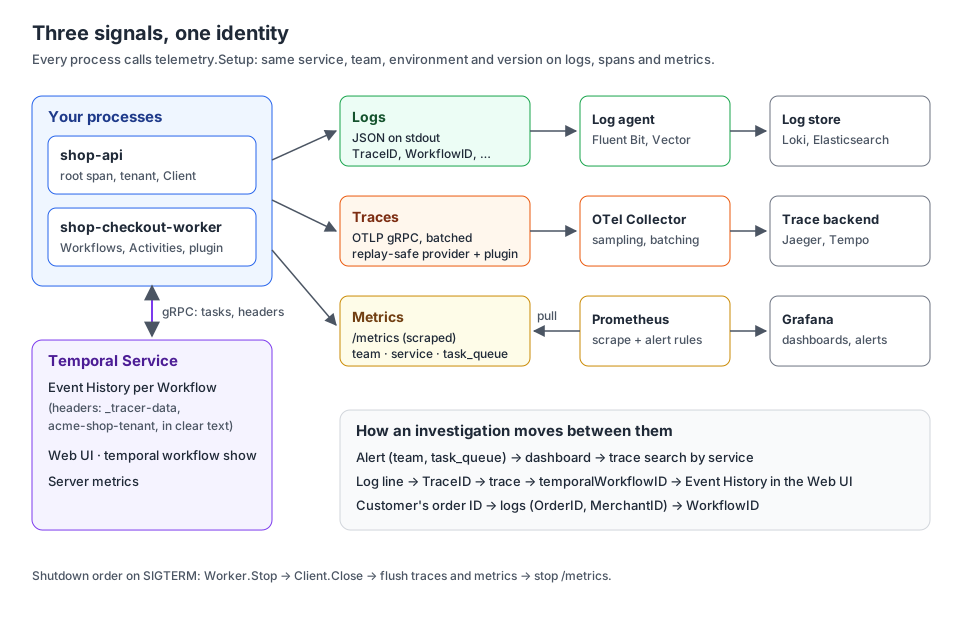
Each process emits three signals, each through the channel that suits it:
| Signal | Leaves the process as | Goes to | Joined by |
|---|---|---|---|
| Logs | JSON lines on stdout | A log agent (Fluent Bit, Vector…), then Loki, Elasticsearch… | TraceID, WorkflowID, MerchantID, service fields |
| Traces | OTLP over gRPC | The OpenTelemetry Collector, then Jaeger, Tempo, Honeycomb… | trace ID; temporalWorkflowID and temporalRunID span attributes |
| Metrics | /metrics, scraped by Prometheus | Prometheus, Grafana | team, service, environment, namespace, task_queue, workflow_type labels |
The Temporal Service keeps its own record next to them: the Event History of each Workflow, visible in the Web UI and with temporal workflow show, and its server metrics. Your logs and traces explain what your code did; the history explains what Temporal did.
3. One Setup for all three signals
Every process (the Worker, the API, a backfill job) calls the same function, so the identity fields can't drift between signals:
// file: internal/telemetry/telemetry.go
package telemetry

import (
	"context"
	"errors"
	"fmt"
	"io"
	"log/slog"
	"net/http"
	"os"

	"github.com/prometheus/client_golang/prometheus"
	"github.com/prometheus/client_golang/prometheus/promhttp"
	"go.opentelemetry.io/otel"
	"go.opentelemetry.io/otel/attribute"
	"go.opentelemetry.io/otel/exporters/otlp/otlptrace/otlptracegrpc"
	otelprom "go.opentelemetry.io/otel/exporters/prometheus"
	sdkmetric "go.opentelemetry.io/otel/sdk/metric"
	"go.opentelemetry.io/otel/sdk/resource"
	sdktrace "go.opentelemetry.io/otel/sdk/trace"
	semconv "go.opentelemetry.io/otel/semconv/v1.41.0"
	"go.temporal.io/sdk/client"
	temporalotel "go.temporal.io/sdk/contrib/opentelemetry-v2"
	"go.temporal.io/sdk/interceptor/tracing"
	"go.temporal.io/sdk/log"
)

// Config identifies the process. The same four values tag logs, traces and metrics,
// so one dashboard filter works everywhere.
type Config struct {
	Service     string // "shop-checkout-worker"
	Team        string // "checkout"
	Environment string // "production"
	Version     string // the build's git SHA
	Collector   string // OTLP gRPC endpoint, e.g. "otel-collector:4317"

	// Overrides for tests: an in-memory span exporter and a log buffer.
	SpanExporter sdktrace.SpanExporter
	LogOutput    io.Writer
}

// Telemetry is everything a process needs to be observable.
type Telemetry struct {
	Logger   log.Logger    // for client.Options.Logger
	Plugin   client.Plugin // for client.Options.Plugins: tracing + SDK metrics
	Metrics  http.Handler  // serve it on /metrics for Prometheus
	Shutdown func(context.Context) error
}

func Setup(ctx context.Context, cfg Config) (*Telemetry, error) {
	// Logs: JSON on stdout, collected by the platform's log agent.
	var logOutput io.Writer = os.Stdout
	if cfg.LogOutput != nil {
		logOutput = cfg.LogOutput
	}
	slogger := slog.New(slog.NewJSONHandler(logOutput, &slog.HandlerOptions{Level: slog.LevelInfo})).With(
		"service", cfg.Service, "team", cfg.Team, "environment", cfg.Environment, "version", cfg.Version)

	res := resource.NewWithAttributes(semconv.SchemaURL,
		semconv.ServiceName(cfg.Service),
		semconv.ServiceVersion(cfg.Version),
		semconv.DeploymentEnvironmentNameKey.String(cfg.Environment),
	)

	// Traces: OTLP to the collector, through the replay-safe provider (chapter 06).
	traceExporter := cfg.SpanExporter
	if traceExporter == nil {
		otlp, err := otlptracegrpc.New(ctx, otlptracegrpc.WithEndpoint(cfg.Collector), otlptracegrpc.WithInsecure())
		if err != nil {
			return nil, fmt.Errorf("otlp trace exporter: %w", err)
		}
		traceExporter = otlp
	}
	tracerProvider := temporalotel.NewReplaySafeTracerProvider(
		sdktrace.WithBatcher(traceExporter),
		sdktrace.WithResource(res),
	)
	otel.SetTracerProvider(tracerProvider)

	// Metrics: a Prometheus registry scraped on /metrics (chapter 05).
	registry := prometheus.NewRegistry()
	promExporter, err := otelprom.New(otelprom.WithRegisterer(registry))
	if err != nil {
		return nil, fmt.Errorf("prometheus exporter: %w", err)
	}
	meterProvider := sdkmetric.NewMeterProvider(sdkmetric.WithReader(promExporter), sdkmetric.WithResource(res))
	otel.SetMeterProvider(meterProvider)

	plugin, err := temporalotel.NewPlugin(temporalotel.PluginOptions{
		TracerOptions: tracing.TracerOptions{
			AddTemporalSpans:        true,
			AllowInvalidParentSpans: true, // a bad header must never fail an order (chapter 07)
		},
		MetricsHandlerOptions: &temporalotel.MetricsHandlerOptions{
			Meter:                meterProvider.Meter("temporal-sdk-go"),
			UseMonotonicCounters: true,
			// Low-cardinality ownership tags on every SDK metric.
			InitialAttributes: attribute.NewSet(
				attribute.String("team", cfg.Team),
				attribute.String("service", cfg.Service),
				attribute.String("environment", cfg.Environment),
			),
			// The default panics on a meter error: log it instead.
			OnError: func(err error) { slogger.Error("temporal metrics", "error", err) },
		},
	})
	if err != nil {
		return nil, err
	}

	return &Telemetry{
		Logger:  log.NewStructuredLogger(slogger),
		Plugin:  plugin,
		Metrics: promhttp.HandlerFor(registry, promhttp.HandlerOpts{}),
		Shutdown: func(ctx context.Context) error {
			// Flush the last spans and metrics. Call after the Worker and Client stop.
			return errors.Join(tracerProvider.Shutdown(ctx), meterProvider.Shutdown(ctx))
		},
	}, nil
}
The choices in it, and why:
- Same identity everywhere.
service,team,environmentandversionare on every log line (slog.With), on every span (the OpenTelemetry resource) and on every SDK metric (InitialAttributes). The Go Observability page recommends these ownership tags for metrics; putting the same values on logs and traces lets one filter work across all three. - Metrics through the plugin.
MetricsHandlerOptionsreplaces the Client'sMetricsHandler, so the plugin carries both traces and SDK metrics. With the plugin there's no handler to callWithTagson:InitialAttributesis how you add global tags (chapter 05 covers metrics in depth). OnErroris set. Its default isfunc(err error) { panic(err) }: a misbehaving meter would crash the Worker.AllowInvalidParentSpans: true. A malformed tracing header otherwise fails the Workflow Execution (chapter 07).- A private Prometheus registry, so only what you register is exposed.
- Test hooks.
SpanExporterandLogOutputlet the test of section 7 capture spans and logs without a collector.
4. The Worker
// file: cmd/worker/main.go
package main

import (
	"context"
	"errors"
	"log"
	"net/http"
	"os"
	"os/signal"
	"syscall"
	"time"

	"go.temporal.io/sdk/client"
	"go.temporal.io/sdk/worker"
	"go.temporal.io/sdk/workflow"

	"github.com/acme/shop/checkout"
	"github.com/acme/shop/internal/telemetry"
	"github.com/acme/shop/internal/tenancy"
)

type stripeGateway struct{}

func (stripeGateway) Charge(ctx context.Context, merchantID, customerID string, amountCents int64) (string, error) {
	return "ch_live_123", nil
}

func main() {
	// Cancelled on SIGINT/SIGTERM (Kubernetes sends SIGTERM before killing the pod).
	ctx, stop := signal.NotifyContext(context.Background(), os.Interrupt, syscall.SIGTERM)
	defer stop()

	tel, err := telemetry.Setup(ctx, telemetry.Config{
		Service:     "shop-checkout-worker",
		Team:        "checkout",
		Environment: os.Getenv("ENVIRONMENT"),
		Version:     os.Getenv("GIT_SHA"),
		Collector:   os.Getenv("OTEL_COLLECTOR"),
	})
	if err != nil {
		log.Fatalln(err)
	}

	metricsServer := &http.Server{Addr: ":9464", Handler: tel.Metrics}
	go func() {
		if err := metricsServer.ListenAndServe(); err != nil && !errors.Is(err, http.ErrServerClosed) {
			tel.Logger.Error("metrics server", "error", err)
		}
	}()

	c, err := client.Dial(client.Options{
		HostPort:           os.Getenv("TEMPORAL_ADDRESS"),
		Logger:             tel.Logger,
		Plugins:            []client.Plugin{tel.Plugin},
		ContextPropagators: []workflow.ContextPropagator{tenancy.NewPropagator()},
	})
	if err != nil {
		log.Fatalln(err)
	}

	w := worker.New(c, checkout.TaskQueue, worker.Options{
		// Default 0: no grace period. Leave room for the flush below in the pod's 30s.
		WorkerStopTimeout: 15 * time.Second,
	})
	w.RegisterWorkflow(checkout.CheckoutWorkflow)
	w.RegisterActivity(&checkout.Activities{Gateway: stripeGateway{}})
	if err := w.Start(); err != nil {
		log.Fatalln(err)
	}
	tel.Logger.Info("worker started", "TaskQueue", checkout.TaskQueue)

	<-ctx.Done()

	// Shutdown order: stop taking work, close the connection, then flush telemetry.
	w.Stop()  // running Activities get up to WorkerStopTimeout to finish
	c.Close() // no more calls to the Service
	flushCtx, cancel := context.WithTimeout(context.Background(), 10*time.Second)
	defer cancel()
	if err := tel.Shutdown(flushCtx); err != nil { // last spans and metrics
		log.Println("telemetry shutdown:", err)
	}
	_ = metricsServer.Shutdown(flushCtx) // last: Prometheus may scrape until the end
}
The shutdown sequence is the part that is easy to get wrong:
| Step | Why this order |
|---|---|
1. <-ctx.Done() on SIGTERM | Kubernetes sends SIGTERM, then SIGKILL after the grace period (30 s by default). Everything below must fit in it |
2. w.Stop() | Stops polling. Running Activities get WorkerStopTimeout to finish (default 0: no grace period, hence the 15 s above; see the Workers guide). Their spans and log lines are produced now |
3. c.Close() | No more calls to the Service, so no more temporal_request metrics or Client spans |
4. tel.Shutdown | Flushes the batched spans and the last metric values. Before step 2, it would drop the spans of the Activities that were finishing |
5. metricsServer.Shutdown | Last, so Prometheus can still scrape while the process drains |
5. The API and the checkout code
The API sets the root span and the tenant, then starts the Workflow. It returns the trace ID to the caller: support can paste it into the tracing UI.
// file: cmd/api/main.go
package main

import (
	"context"
	"encoding/json"
	"log"
	"net/http"
	"os"

	"go.opentelemetry.io/otel"
	"go.temporal.io/sdk/client"
	"go.temporal.io/sdk/workflow"

	"github.com/acme/shop/checkout"
	"github.com/acme/shop/internal/telemetry"
	"github.com/acme/shop/internal/tenancy"
)

func main() {
	ctx := context.Background()
	tel, err := telemetry.Setup(ctx, telemetry.Config{
		Service: "shop-api", Team: "checkout",
		Environment: os.Getenv("ENVIRONMENT"), Version: os.Getenv("GIT_SHA"),
		Collector: os.Getenv("OTEL_COLLECTOR"),
	})
	if err != nil {
		log.Fatalln(err)
	}
	defer func() { _ = tel.Shutdown(context.Background()) }()

	c, err := client.Dial(client.Options{
		HostPort:           os.Getenv("TEMPORAL_ADDRESS"),
		Logger:             tel.Logger,
		Plugins:            []client.Plugin{tel.Plugin},
		ContextPropagators: []workflow.ContextPropagator{tenancy.NewPropagator()},
	})
	if err != nil {
		log.Fatalln(err)
	}
	defer c.Close()

	http.Handle("GET /metrics", tel.Metrics)
	http.HandleFunc("POST /orders", func(w http.ResponseWriter, r *http.Request) {
		ctx, span := otel.Tracer("github.com/acme/shop/api").Start(r.Context(), "POST /orders")
		defer span.End()

		// The merchant comes from the authenticated API key, resolved by middleware.
		ctx = tenancy.WithTenant(ctx, tenancy.Tenant{MerchantID: r.Header.Get("X-Merchant-ID"), Plan: "growth"})

		var order checkout.Order
		if err := json.NewDecoder(r.Body).Decode(&order); err != nil {
			http.Error(w, "bad order", http.StatusBadRequest)
			return
		}
		run, err := c.ExecuteWorkflow(ctx, client.StartWorkflowOptions{
			ID: "checkout-" + order.ID, TaskQueue: checkout.TaskQueue,
		}, checkout.CheckoutWorkflow, order)
		if err != nil {
			tel.Logger.Error("start checkout", "OrderID", order.ID, "error", err)
			http.Error(w, "could not start checkout", http.StatusInternalServerError)
			return
		}
		w.WriteHeader(http.StatusAccepted)
		_ = json.NewEncoder(w).Encode(map[string]string{"workflow_id": run.GetID(), "trace_id": span.SpanContext().TraceID().String()})
	})
	log.Fatalln(http.ListenAndServe(":8080", nil))
}
The checkout code uses chapter 03's internal/tenancy package unchanged (the Tenant type, the propagator and WorkflowLogger). Copy internal/tenancy/tenant.go and internal/tenancy/propagator.go from chapter 03 into this module.
// file: checkout/workflow.go
package checkout

import (
	"time"

	temporalotel "go.temporal.io/sdk/contrib/opentelemetry-v2"
	"go.temporal.io/sdk/workflow"

	"github.com/acme/shop/internal/tenancy"
)

const TaskQueue = "checkout"

type Order struct {
	ID          string
	CustomerID  string
	AmountCents int64
}

func CheckoutWorkflow(ctx workflow.Context, order Order) (string, error) {
	ctx, span := temporalotel.Tracer("github.com/acme/shop/checkout").Start(ctx, "checkout")
	defer span.End()

	logger := tenancy.WorkflowLogger(ctx) // + MerchantID; the plugin adds TraceID and SpanID
	logger.Info("checkout started", "OrderID", order.ID)

	ctx = workflow.WithActivityOptions(ctx, workflow.ActivityOptions{StartToCloseTimeout: 30 * time.Second})
	var a *Activities
	if err := workflow.ExecuteActivity(ctx, a.ReserveInventory, order).Get(ctx, nil); err != nil {
		return "", err
	}
	var chargeID string
	if err := workflow.ExecuteActivity(ctx, a.ChargePayment, order).Get(ctx, &chargeID); err != nil {
		logger.Error("payment failed", "OrderID", order.ID, "Error", err)
		return "", err
	}
	logger.Info("checkout completed", "OrderID", order.ID, "ChargeID", chargeID)
	return chargeID, nil
}// file: checkout/activities.go
package checkout
import (
"context"
"go.opentelemetry.io/otel"
"go.opentelemetry.io/otel/attribute"
"go.opentelemetry.io/otel/codes"
"go.temporal.io/sdk/activity"
"github.com/acme/shop/internal/tenancy"
)
type PaymentGateway interface {
Charge(ctx context.Context, merchantID, customerID string, amountCents int64) (string, error)
}
type Activities struct {
Gateway PaymentGateway
}
func (a *Activities) ReserveInventory(ctx context.Context, order Order) error {
activity.GetLogger(ctx).Info("stock reserved", "OrderID", order.ID)
return nil
}
func (a *Activities) ChargePayment(ctx context.Context, order Order) (string, error) {
tenant, _ := tenancy.FromContext(ctx) // propagated by the tenancy propagator (chapter 03)
ctx, span := otel.Tracer("github.com/acme/shop/checkout").Start(ctx, "payment-gateway.charge")
defer span.End()
// The merchant on the span, not on metrics: span attributes may be high-cardinality.
span.SetAttributes(attribute.String("shop.merchant_id", tenant.MerchantID), attribute.String("shop.order_id", order.ID))
chargeID, err := a.Gateway.Charge(ctx, tenant.MerchantID, order.CustomerID, order.AmountCents)
if err != nil {
span.SetStatus(codes.Error, "charge failed")
return "", err
}
// activity.GetLogger already carries TraceID and SpanID: logs and traces join up.
activity.GetLogger(ctx).Info("payment captured", "OrderID", order.ID, "MerchantID", tenant.MerchantID)
return chargeID, nil
}Two details:
- The Workflow logs through
tenancy.WorkflowLogger, which addsMerchantID. Nothing in this code addsTraceIDandSpanID: the plugin does. With the plugin installed,workflow.GetLoggerandactivity.GetLoggerreturn loggers that already carry the current trace and span IDs (the plugin's tracer implements the SDK'sGetLoggerhook). This works even withoutAddTemporalSpans. shop.merchant_idgoes on the span, not on a metric. Span attributes can be high-cardinality (one value per merchant or order); metric labels must not be (section 8).
6. Two propagators side by side
The Worker's Client has both the tracing plugin and the tenant propagator. They don't interfere: each writes its own header field, _tracer-data and acme-shop-tenant. They also don't share a lifecycle:
| Tracing context (plugin) | Tenant (your propagator) | |
|---|---|---|
| Purpose | Observability: connect spans | Business logic: which merchant's data to use |
| If it's lost | A trace is split in two | The order may be charged to the wrong account |
| Readable in Workflow code | No (no accessor in v0.1.0) | Yes, tenancy.FromWorkflow |
| Tested by | The test below | Chapter 03's tests |
Keep anything the business logic depends on out of tracing baggage (chapter 07).
7. Prove it with a test
"We have observability" is a claim you can test. This test runs one checkout against a dev server with the real telemetry.Setup and checks the three signals:
// file: checkout/observability_test.go
package checkout

import (
	"bufio"
	"bytes"
	"context"
	"encoding/json"
	"net/http/httptest"
	"os"
	"strings"
	"testing"

	"go.opentelemetry.io/otel"
	"go.opentelemetry.io/otel/sdk/trace/tracetest"
	"go.temporal.io/sdk/client"
	temporalotel "go.temporal.io/sdk/contrib/opentelemetry-v2"
	"go.temporal.io/sdk/testsuite"
	"go.temporal.io/sdk/worker"
	"go.temporal.io/sdk/workflow"

	"github.com/acme/shop/internal/telemetry"
	"github.com/acme/shop/internal/tenancy"
)

type fakeGateway struct{}

func (fakeGateway) Charge(ctx context.Context, merchantID, customerID string, amountCents int64) (string, error) {
	return "ch_test_1", nil
}

// TestCheckoutIsObservable checks the three signals of one checkout: a single trace,
// logs that carry its trace ID and the merchant, and SDK metrics with ownership tags.
func TestCheckoutIsObservable(t *testing.T) {
	ctx := context.Background()
	spans := tracetest.NewInMemoryExporter()
	var logs bytes.Buffer
	tel, err := telemetry.Setup(ctx, telemetry.Config{
		Service: "shop-checkout-worker", Team: "checkout", Environment: "test", Version: "dev",
		SpanExporter: spans, LogOutput: &logs,
	})
	if err != nil {
		t.Fatal(err)
	}
	defer func() { _ = tel.Shutdown(ctx) }()

	srv, err := testsuite.StartDevServer(ctx, testsuite.DevServerOptions{ExistingPath: os.Getenv("TEMPORAL_CLI"), LogLevel: "error"})
	if err != nil {
		t.Fatal(err)
	}
	defer func() { _ = srv.Stop() }()

	c, err := client.Dial(client.Options{
		HostPort:           srv.FrontendHostPort(),
		Logger:             tel.Logger,
		Plugins:            []client.Plugin{tel.Plugin},
		ContextPropagators: []workflow.ContextPropagator{tenancy.NewPropagator()},
	})
	if err != nil {
		t.Fatal(err)
	}
	defer c.Close()
	w := worker.New(c, TaskQueue, worker.Options{})
	w.RegisterWorkflow(CheckoutWorkflow)
	w.RegisterActivity(&Activities{Gateway: fakeGateway{}})
	if err := w.Start(); err != nil {
		t.Fatal(err)
	}
	defer w.Stop()

	reqCtx, root := otel.Tracer("test").Start(ctx, "POST /orders")
	reqCtx = tenancy.WithTenant(reqCtx, tenancy.Tenant{MerchantID: "m-7731", Plan: "growth"})
	run, err := c.ExecuteWorkflow(reqCtx, client.StartWorkflowOptions{ID: "checkout-A1003", TaskQueue: TaskQueue},
		CheckoutWorkflow, Order{ID: "A1003", CustomerID: "C42", AmountCents: 3200})
	if err != nil {
		t.Fatal(err)
	}
	if err := run.Get(ctx, nil); err != nil {
		t.Fatal(err)
	}
	root.End()
	traceID := root.SpanContext().TraceID().String()

	// 1. Traces: everything in the request's trace.
	if err := otel.GetTracerProvider().(*temporalotel.ReplaySafeTracerProvider).ForceFlush(ctx); err != nil {
		t.Fatal(err)
	}
	for _, s := range spans.GetSpans() {
		if s.SpanContext.TraceID().String() != traceID {
			t.Errorf("span %q is not in the request's trace", s.Name)
		}
	}
	t.Logf("traces: %d spans in trace %s", len(spans.GetSpans()), traceID)

	// 2. Logs: the Workflow's and Activities' lines carry the trace ID and the merchant.
	scanner := bufio.NewScanner(&logs)
	for scanner.Scan() {
		var line map[string]any
		if json.Unmarshal(scanner.Bytes(), &line) != nil {
			continue
		}
		switch line["msg"] {
		case "checkout started", "payment captured", "checkout completed":
			if line["TraceID"] != traceID {
				t.Errorf("log %q has TraceID %v", line["msg"], line["TraceID"])
			}
			t.Logf("log: %s", scanner.Text())
		}
	}

	// 3. Metrics: scrape /metrics as Prometheus would.
	rec := httptest.NewRecorder()
	tel.Metrics.ServeHTTP(rec, httptest.NewRequest("GET", "/metrics", nil))
	for _, l := range strings.Split(rec.Body.String(), "\n") {
		if strings.HasPrefix(l, "temporal_workflow_completed") || strings.HasPrefix(l, "temporal_activity_execution_latency_seconds_count") {
			if !strings.Contains(l, `team="checkout"`) {
				t.Errorf("metric without the team tag: %s", l)
			}
			t.Logf("metric: %s", l)
		}
	}
}$ TEMPORAL_CLI=$(which temporal) go test -run TestCheckoutIsObservable -v ./checkout
observability_test.go:93: traces: 9 spans in trace 18b3388ed5547fb1a1f7f547a188d93c
observability_test.go:107: log: {"time":"2026-10-25T23:38:34.230391+01:00","level":"INFO","msg":"checkout started","service":"shop-checkout-worker","team":"checkout","environment":"test","version":"dev","Namespace":"default","TaskQueue":"checkout","WorkerID":"1125@J9L636DG4L@","WorkflowType":"CheckoutWorkflow","WorkflowID":"checkout-A1003","RunID":"01a17537-32ef-78d5-ae8e-f88ba066d9f1","Attempt":1,"TraceID":"18b3388ed5547fb1a1f7f547a188d93c","SpanID":"cd115e3e6e9c89f9","MerchantID":"m-7731","OrderID":"A1003"}
observability_test.go:107: log: {"time":"2026-10-25T23:38:34.235742+01:00","level":"INFO","msg":"payment captured","service":"shop-checkout-worker","team":"checkout","environment":"test","version":"dev","Namespace":"default","TaskQueue":"checkout","WorkerID":"1125@J9L636DG4L@","ActivityID":"11","ActivityType":"ChargePayment","Attempt":1,"WorkflowType":"CheckoutWorkflow","WorkflowID":"checkout-A1003","RunID":"01a17537-32ef-78d5-ae8e-f88ba066d9f1","TraceID":"18b3388ed5547fb1a1f7f547a188d93c","SpanID":"9d3dbaad6e32d246","OrderID":"A1003","MerchantID":"m-7731"}
observability_test.go:107: log: {"time":"2026-10-25T23:38:34.237475+01:00","level":"INFO","msg":"checkout completed","service":"shop-checkout-worker","team":"checkout","environment":"test","version":"dev","Namespace":"default","TaskQueue":"checkout","WorkerID":"1125@J9L636DG4L@","WorkflowType":"CheckoutWorkflow","WorkflowID":"checkout-A1003","RunID":"01a17537-32ef-78d5-ae8e-f88ba066d9f1","Attempt":1,"TraceID":"18b3388ed5547fb1a1f7f547a188d93c","SpanID":"cd115e3e6e9c89f9","MerchantID":"m-7731","OrderID":"A1003","ChargeID":"ch_test_1"}
observability_test.go:119: metric: temporal_activity_execution_latency_seconds_count{activity_type="ChargePayment",client_name="temporal_go",environment="test",namespace="default",otel_scope_name="temporal-sdk-go",otel_scope_schema_url="",otel_scope_version="",service="shop-checkout-worker",task_queue="checkout",team="checkout",worker_type="none",workflow_type="CheckoutWorkflow"} 1
observability_test.go:119: metric: temporal_activity_execution_latency_seconds_count{activity_type="ReserveInventory",client_name="temporal_go",environment="test",namespace="default",otel_scope_name="temporal-sdk-go",otel_scope_schema_url="",otel_scope_version="",service="shop-checkout-worker",task_queue="checkout",team="checkout",worker_type="none",workflow_type="CheckoutWorkflow"} 1
observability_test.go:119: metric: temporal_workflow_completed_total{activity_type="none",client_name="temporal_go",environment="test",namespace="default",otel_scope_name="temporal-sdk-go",otel_scope_schema_url="",otel_scope_version="",service="shop-checkout-worker",task_queue="checkout",team="checkout",worker_type="none",workflow_type="CheckoutWorkflow"} 1
--- PASS: TestCheckoutIsObservable (1.27s)What the output proves:
- Logs ↔ traces. The
TraceIDon the Workflow's and the Activity's log lines is the request's trace ID. In your log UI, a click on it opens the trace. The Workflow lines share oneSpanID(the Workflow's span); the Activity line has theRunActivityspan's ID. - Logs ↔ Temporal. Each line has
WorkflowIDandRunID(added by the SDK), so you can jump to the Event History. WithMerchantIDandOrderID, support can search by what the customer reports. - Metrics ↔ owners. Every SDK metric has the
team,serviceandenvironmentlabels fromInitialAttributes, next to the SDK's ownnamespace,task_queueandworkflow_type. - Prometheus names differ from the reference. The OpenTelemetry Prometheus exporter adds unit and type suffixes: the SDK's
temporal_activity_execution_latencybecomestemporal_activity_execution_latency_seconds_*,temporal_workflow_completedbecomestemporal_workflow_completed_total, andtemporal_sticky_cache_total_forced_evictionshowed up astemporal_sticky_cache_forced_eviction_total. Build dashboards from what/metricsactually exposes.
Run this test in CI. It fails if someone drops the plugin from a Client, forgets the propagator, or replaces the logger with one that loses the fields.
8. Production checklist
Alert on
Names as in the SDK metrics reference (add the Prometheus suffixes as shown above). Each alert should route to the team label.
| Metric | Bad sign | Usual cause |
|---|---|---|
temporal_workflow_task_schedule_to_start_latency | High p95 (seconds, not milliseconds) | Not enough Workers, or Workers saturated, for Workflow Tasks |
temporal_activity_schedule_to_start_latency | High p95 | Not enough Activity slots or Workers; the StartActivity → RunActivity gap in traces |
temporal_worker_task_slots_available | At 0 for minutes | Workers saturated: scale out or raise slot limits |
temporal_workflow_task_execution_failed | Any sustained rate | A bug or non-determinism in Workflow code; it blocks the Workflows (see the Error handling guide) |
temporal_activity_execution_failed | Rate above normal | A dependency (payment gateway, inventory API) is failing |
temporal_workflow_failed | Rate above normal | Business failures reaching the end of the Workflow |
temporal_request_failure, temporal_long_request_failure | Any sustained rate | Workers can't reach the Temporal Service (network, auth, rate limits) |
Put on the dashboard
- Started vs completed vs failed Workflows per
workflow_type. - Schedule-to-start latency (Workflow and Activity) per
task_queue: the first graph to look at in an incident. - Activity execution latency and failure rate per
activity_type. - Task slots used vs available per
service. temporal_sticky_cache_hitvstemporal_sticky_cache_miss, and forced evictions: a low hit rate means full replays and higher CPU.- A link from each panel to the trace search filtered by the same
service.
Never
| Never… | Because |
|---|---|
| Put credentials, tokens or personal data in baggage or in your own propagated headers | Headers are stored in clear text in the Event History, not encrypted by your payload codec (chapter 07) |
| Use a Workflow ID, order ID or merchant ID as a metric label | One time series per value: the metrics backend's storage explodes. Put them on spans and log lines instead |
| Log full Workflow or Activity inputs | They often contain addresses and card data; log IDs |
Use otel.Tracer or time.Now for spans in Workflow code | Not replay-safe: duplicate spans with wrong times (chapter 06) |
| Let a process exit without flushing | The last spans are the ones you need after a crash |
Leave MetricsHandlerOptions.OnError at its default | It panics |
9. Key takeaways
- Build telemetry in one
Setupshared by every process. The sameservice,team,environmentandversiongo on logs, spans and metrics. - The plugin carries both traces and SDK metrics. Use
MetricsHandlerOptions.InitialAttributesfor global tags and setOnError, whose default panics. - With the plugin,
workflow.GetLoggerandactivity.GetLoggeraddTraceIDandSpanIDby themselves: logs and traces are joined with no extra code. - Stop in this order: Worker, Client, telemetry flush, metrics endpoint.
- Business context (the tenant) travels in your own propagator; observability context in the plugin. Neither may contain secrets: both are stored in the Event History.
- High-cardinality IDs belong on spans and log lines, never on metric labels.
- Test observability like any other feature: one checkout, one trace, correlated logs, tagged metrics.